formhub is designed to make data collection simple and collaborative. But data collection is only a means… the end goal is gaining insights from data. While formhub cannot provide the rich variety of analysis needed for every dataset, we have been recently been working on features that should give formhub users some basic and rapid insights about data as soon as it is collected.
The immediate goals are to allow formhub’s users to:
Color the map according to responses to select questions. For example, the screenshot below shows our responses to a water questionnaire color coded by responses to a question about mobile signal strength near Port A Piment in Haiti, which shows that signal strength is high (red in this case) only along the coast:
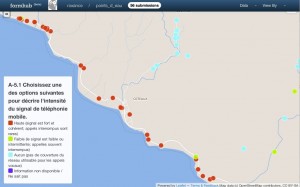 Right now, this feature is enabled for “select one” questions; we will soon be extending it to numerical and date responses as well.
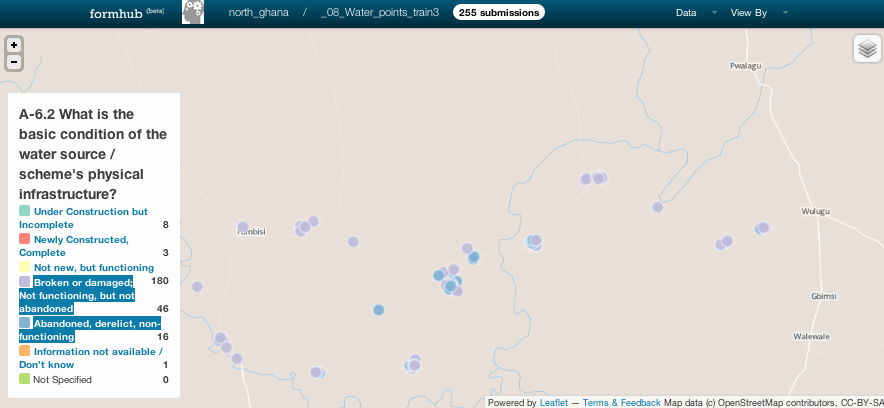
Filter responses on the map by selecting a particular response and a filter criteria–for example, view all the data where the respondent's age is between 25 and 30. This feature is up and coming; we hope it allows users to explore datasets with large number of datapoints (which may overlap with each other). UPDATE: This is now possible: in the legend, you will see that some of the answer-responses appear as a link. Click one of them, and the points on the map will be filtered; only responses that have that particular answer show up. You can also click on multiple items, or click on the link again to remove the filter. See picture below for example:

The Implementation Details
In order to develop these features, we have developed an API that allows retrieval of responses via the URL http://formhub.org/
We have also migrated the map to the open source Leaflet library. The Leaflet library includes a number of features that makes it suitable for formhub:
It provides support for a variety of map providers. With this, we have added three maps that are easily switchable from the button on the top right corner i.e. An Open Street Map, a Bing Road Map and a Bing Satelite Map
It includes out of the box support for the GeoJSON map data format. This allows us to easily modify the map data using client-side javascript.
The first item of the analysis goals is now live on the maps. To use this feature, click on the item labeled "View By“ on the top right and pick a response to use.
As always, any feedback on what we can do to improve these tools will be greatly appreciated.