Prabhas Pokharel
In this blog post, I want to introduce a feature we’ve added to formhub a little while back: spatial summarization using hexagonal bins.
The idea of hexagonal binning of 2D space is extremely similar to that of histograms, just extended to 2D space. You take the range of data, split it into several chunks, and compare an aggregation across these chunks. Instead of the line that forms a base of the histogram, we choose hexagonal bins as our “chunk,” and represent aggregate data using colors rather than height or width. I’ll let this article do the talking if you are interested in learning more, and move on to examples.
At formhub, we have enabled two different forms of spatial summarization:
Counts
This is the most basic (and often most useful) form of summarization, showing the distribution of counts across space. Lets say, in a survey about water points in some area, we want to answer a basic question: what is the distribution of water points across the survey area? While the spatial scatter of the map view already gives us a basic clue, hex bins can alleviate problems overplotting might cause, and give us a glance at this information. On the top-right “layers” control (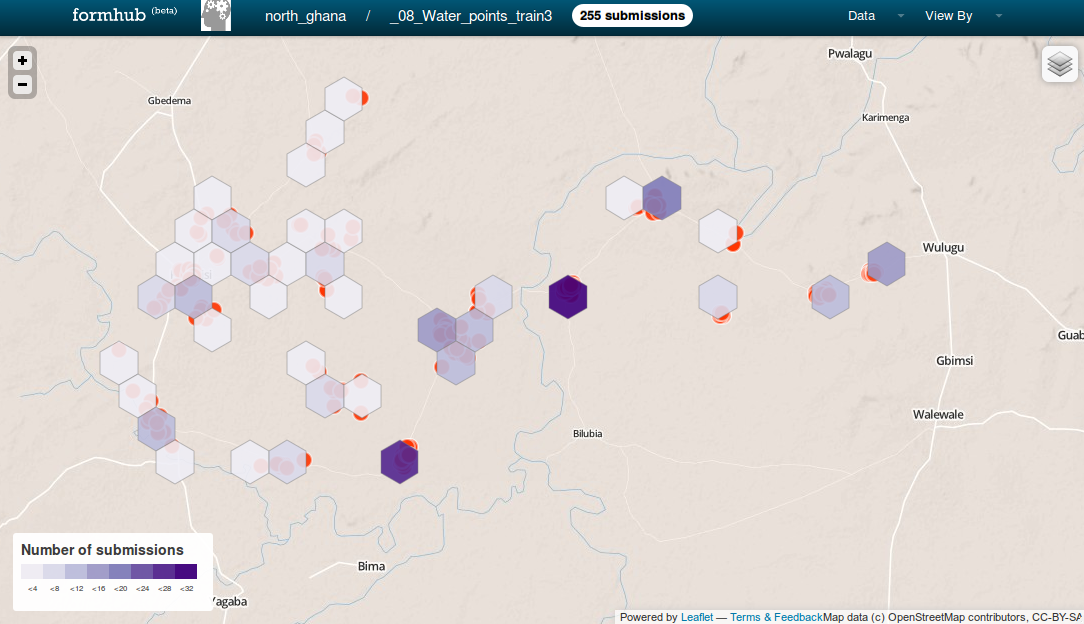 ) , select the “Hexbin layer” checkbox to see this summarization.
Proportion of given response(s)
This count-based summarization is quite useful, but easy to do in GIS and other software, particularly because a survey will only produce a single unique count-based summarization.
The power of hexbins in formhub is that they allow you to look at your data in a much richer way. In a water point survey, for example, you might care about what proportion of water points within a given area are non-functional. To do that, you would click on “View by”, find the question whose responses you want to spatially visualize (such as “Is the water point functional”) and select “No” in the legend.
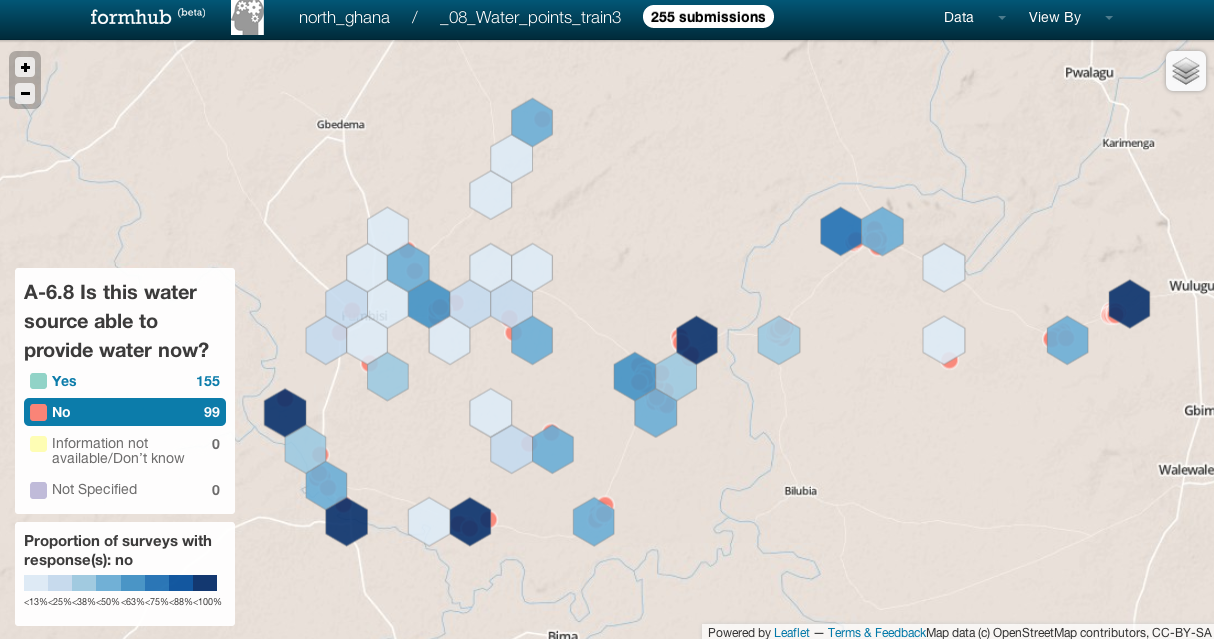
What you see, denoted by the intensity of blue in this view, is the percentage of water points that are non-functional in an area. You can in fact go ahead and click on any select-one question in the view-by menu, and select any option to look at how the responses to that questions are spread spatially. We believe this is quite a powerful feature, given that you can choose which response in a particular survey is most valuable to you. In the water points case above, the hexbin density map can practically be used to set the agenda for which areas are in the most need to their water points being fixed!
The caveat here is that a deep blue hexagonal bin may represent an area where the only water point is non-functional, or an area where 10 out of 10 water points are non-functional. We made the default coloration proportion rather than count because we think that is more important and hard to derive; we’ll add a toggle to color hex bins by ‘the number of non-functional water points in an area’ when we redesign the map page in the early fall.
Let us know what you think of this feature either here in the comments or on the formhub-users mailing list, particularly if you come up with interesting uses or insights from the feature. And thanks to github user @indiemaps for contributing the javascript library that performs much of the heavy lifting for this feature.