Radhika Iyengar
Picture this! I am in a rural District in India. I have been tasked to conduct a situation analysis of Education needs in the district. Sitting in the District Collectors Office (An officer who is in charge of the District’s functioning for all the Sectors). Where do I start? “I need a map of the district” I call out loudly. I am pointed out to a map behind the District Collector’s chair on the wall. I begin to hand draw the map on a piece of paper. The same day I leave with the District Education Officer in a Jeep and trying to follow the map. There seems to be some debate over the map (or my drawing) on the boundaries of the District. Amidst much debate, I try to plot schools on the locations of the schools on the map. In a separate piece of paper, I quickly write down the name of the school and its needs (toilets (Y/N), water availability (Y/N) etc.). School after school I did this, however it is impossible to cover the district because there are more than 200 primary schools in the district that are all spread out. In the rainy season, few schools are inaccessible due to bad roads and potholes. We come back and I begin searching through DISE (District Information Systems for Education) an online repository of all schools for the District (for the entire country). I begin searching the names of the schools in DISE to the ones that I visit. “There must be something wrong“ I say to myself. I couldn’t find two from the five schools I visited. “Did I write down the right name? “ maybe that school was in this district, but how is this possible?” are some of the thoughts in my head. In some cases the facility inventories did not match what I saw.
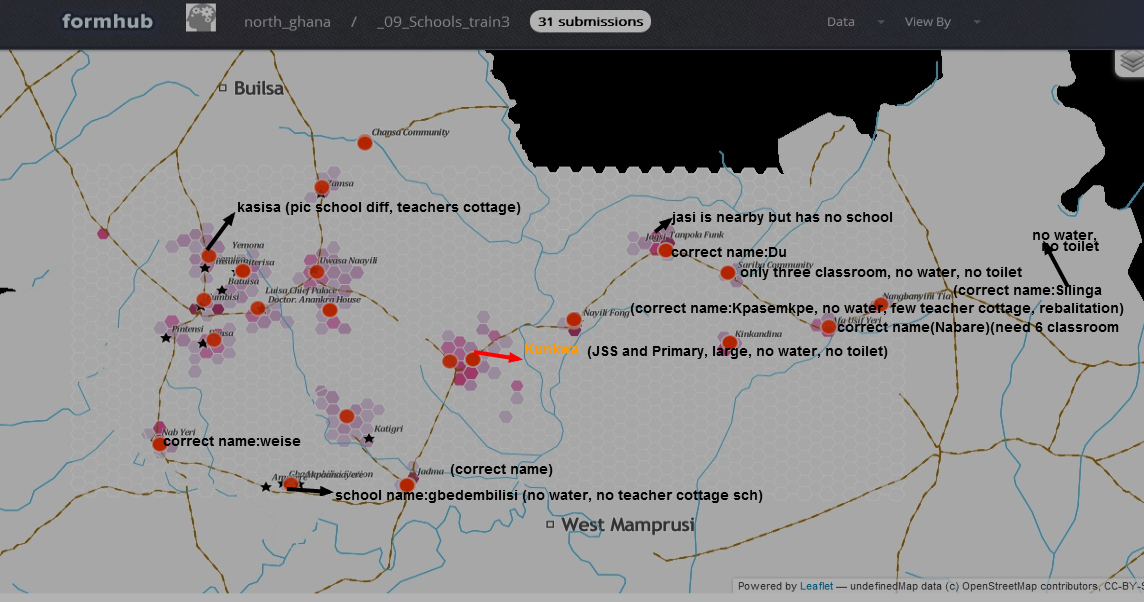
This is not an un-usual scenario for Education planners. However things have changed…all due to an innovative use of technology. In my recent visit to an MVP site in Ghana at Bolgatanga. The MVP had recently completed a basic school inventory of all schools in the MVP defined cluster. This survey was conducted using android phones that did not involve data entry at all. The survey included some of the basic information needed for Education planning such as –water and sanitation, furniture, teacher and teacher training, number of students enrolled etc. Along with this a GPS location of each school and photo of the school was uploaded onto to the server using phones. The data was processed and displayed on maps with school points and a pull down menu of the characteristics of the schools. This detailed data removed the guess work involved and the anecdotal evidence that an Education planner has to most often rely on. The snapshots of the MVP cluster maps are given below.
We followed the route (in brown) and saw the schools, had an excel sheet with all the data points for the particular schools. The excel sheet with the data points helped to categorize how many schools needed a lot of investments, how many schools needed moderate investments and how many schools needed very little investments, based on the categories that were recorded. However the data in the excel sheet for each school did not give a sense of the need or the coverage of the cluster. The maps were helpful to see the coverage of area with school facilities and the excel sheets with updated data was able to inform the magnitude of the needs. The maps also had population clusters to inform whether a densely populated cluster or village had a school within the proximity. In a quick look, we were able to see if the population clusters had atleast one school in the cluster. The maps are also useful to observe the coverage of the cluster, therefore maps was useful to tell us if there is a part of the cluster where there are no schools located. In terms of planning, we could assess if there pockets of population where maybe a Kindergarten classes need to be established since the nearest school is more than 4-5 km away. Maps also become a useful platform to engage in discussions with the District Education Office and ask them (without anecdotes) on what visible gaps they can fill and how can MVP supplement. We were able to put all sorts of planning notes on the maps itself to be able to internally discuss with the MVP data team and the Education Sector staff on some data that had to be validated. At the end of our discussions a round of data validation round was proposed for some specific schools. As for the Education Sector planning, the maps and data helped us to better understand the scope of the Education needs in the cluster and prepare our budgets accordingly.
(The Author would like to acknowledge Modi Research lab for making the maps accessible and the MVP MVIG team for the data collection efforts at the site)